
")
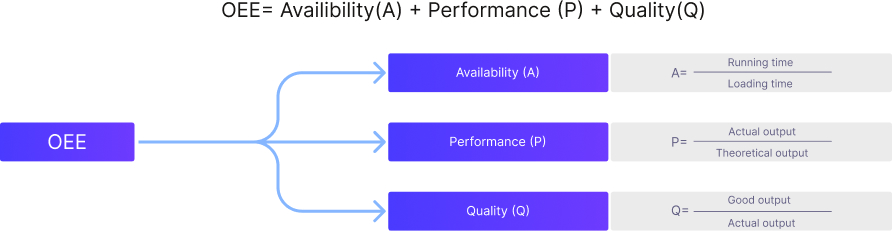
- Availability
This measures the proportion of scheduled time that the operation is available to produce. Availability takes into account both planned and unplanned stops, including downtime due to equipment failures, maintenance, line changeovers, and external factors such as the unavailability of input materials.

- Performance
Performance reflects the speed at which your equipment operates compared to its optimal or target speed. It accounts for losses arising from running the equipment at speeds below the target rate. The ideal performance rate is defined as the best demonstrated instantaneous rate at which a product can run through the system’s chokepoint.
- Quality
Quality measures the ability of the equipment to produce defect-free output on the first pass. It takes into account losses resulting from scrap, rework, in-process damage, and out-of-spec production.

- Set Clear Objectives:
To begin the journey towards improved OEE, it is crucial to set clear objectives. Align these goals with the overall business objectives of the facility. Whether it’s reducing downtime, enhancing equipment performance, or improving product quality, defining specific targets will provide focus and direction. - Measure and Track OEE:
Implementing a systematic method for measuring and tracking OEE is essential. Collect data on availability, performance, and quality metrics for each equipment or process. Utilize modern technology to automate data collection and establish a centralized system for storing and analyzing this information. - Identify and Analyze Losses:
Uncover the major causes of equipment downtime, production slowdowns, and quality defects. Analyze the collected data to identify root causes and prioritize improvement efforts accordingly. Whether it’s equipment breakdowns, inefficient changeovers, or inadequate maintenance practices, understanding the losses is key to addressing them effectively. - Implement Total Productive Maintenance (TPM):
Total Productive Maintenance (TPM) practices are vital for improving equipment reliability, reducing downtime, and extending equipment life. Regular preventive maintenance, operator involvement in maintenance activities, and continuous equipment monitoring can significantly enhance equipment performance and availability. - Optimize Changeover and Setup Times:
Lengthy changeover and setup times can hinder productivity. By streamlining these processes, manufacturers can minimize equipment idle time and maximize overall equipment performance. Standardize work procedures, invest in efficient tooling, and design equipment for quick changeovers to reduce setup times and boost productivity. - Implement Continuous Improvement Initiatives:
To foster a culture of continuous improvement, involve employees in problem-solving and process optimization activities. Utilize methodologies such as Kaizen, Lean manufacturing, and Six Sigma to identify and eliminate waste and variability. Encourage employees to suggest improvements and provide them with the necessary training and tools to contribute effectively. - Enhance Workforce Skills and Training:
Invest in training programs to improve the skills and knowledge of employees involved in operating and maintaining equipment. Equip them with a deep understanding of OEE and its significance. Empowered and knowledgeable employees are more likely to actively contribute to OEE improvement initiatives. - Enhance Workforce Skills and Training:
Invest in training programs to improve the skills and knowledge of employees involved in operating and maintaining equipment. Equip them with a deep understanding of OEE and its significance. Empowered and knowledgeable employees are more likely to actively contribute to OEE improvement initiatives. - Implement Real-time Monitoring and Visualization:
Leverage advanced technologies like Industrial IoT and data analytics to monitor equipment performance in real-time. By implementing real-time monitoring systems, manufacturers can identify performance gaps promptly, allowing for swift corrective actions. Display OEE metrics and performance data on dashboards throughout the facility to create visibility and promote awareness. - Establish Performance Metrics and Accountability:
Define key performance indicators (KPIs) related to OEE and establish accountability for meeting these targets. Regularly review performance against these targets and provide feedback to employees and teams. By fostering a culture of accountability, everyone becomes actively involved in driving OEE improvements. - Foster Collaboration and Communication:
Promote cross-functional collaboration between production, maintenance, engineering, and quality teams. Encourage open lines of communication and ensure timely information sharing. By fostering a collaborative environment, organizations can address OEE-related issues collectively, leveraging diverse perspectives and expertise.
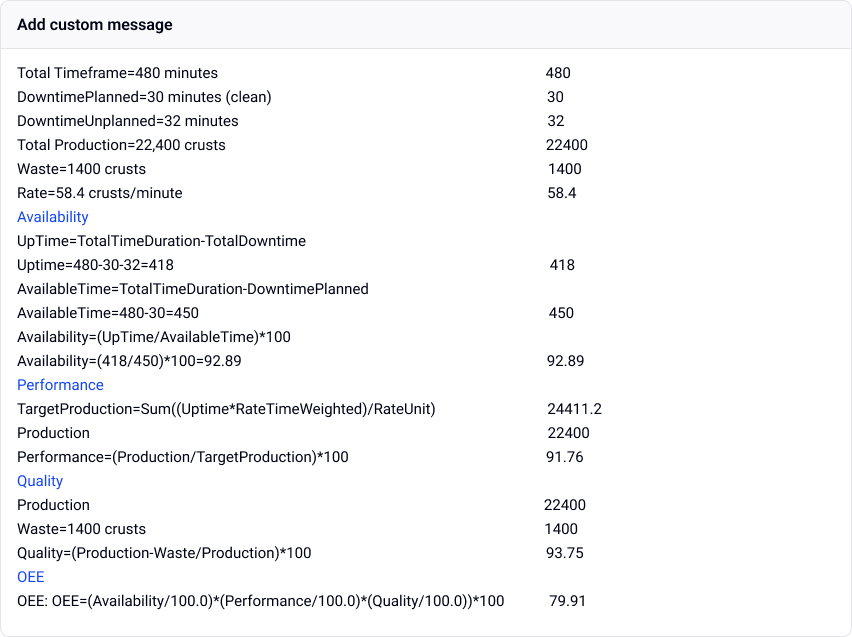
Based on the example data provided, let’s break down the calculation of the different components of OEE: - Availability:
The total timeframe is given as 480 minutes. Planned downtime for cleaning is 30 minutes, and unplanned downtime is 32 minutes. To calculate the uptime, subtract the total downtime from the total time duration: 480 – 30 – 32 = 418 minutes. The available time is calculated by subtracting the planned downtime from the total time duration: 480 – 30 = 450 minutes. The availability is then determined by dividing the uptime by the available time and multiplying by 100: (418 / 450) * 100 = 92.89%. - Performance:
The target production is calculated using the formula: Sum((Uptime * RateTimeWeighted) / RateUnit). In this case, the target production is 24,411.2 crusts. The actual production is given as 22,400 crusts. To calculate performance, divide the actual production by the target production and multiply by 100: (22,400 / 24,411.2) * 100 = 91.76%. - Quality:
The production is given as 22,400 crusts, and the waste is 1,400 crusts. To calculate the quality, subtract the waste from the production, divide by the production, and multiply by 100: ((22,400 – 1,400) / 22,400) * 100 = 93.75%. - OEE:
Finally, the OEE is calculated by multiplying the availability, performance, and quality percentages together and dividing by 100: (92.89 / 100) * (91.76 / 100) * (93.75 / 100) * 100 = 79.91%.
In this example, the OEE for the given data is 79.91%. OEE provides a comprehensive view of equipment effectiveness, taking into account availability, performance, and quality metrics, allowing manufacturers to identify areas for improvement and maximize operational efficiency.
Agile MES: The Key to Unlocking Smart Manufacturing Success
MES is a computerized system used in manufacturing operations to track and document the transformation of raw materials into finished goods. An MES system typically manages and monitors work orders, equipment, materials, and personnel on the shop floor. The system provides real-time visibility into production processes, helps optimize manufacturing operations, and improves the overall efficiency of the manufacturing process.

Understanding OEE: The Key to Manufacturing Efficiency
In today’s competitive manufacturing landscape, improving efficiency and productivity is crucial for businesses to remain competitive. One of the key metrics used to measure manufacturing efficiency is OEE or Overall Equipment Effectiveness. In this blog, we will take a closer look at OEE and its importance in manufacturing.
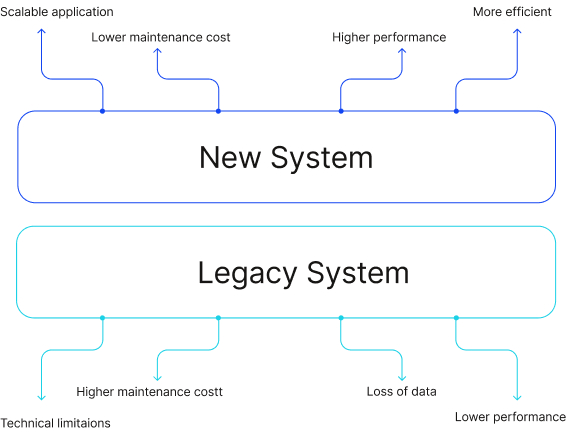
How to Effectively Conduct a Legacy System Integration
Legacy system integration can be a daunting task, but it’s a necessary one for many manufacturers that rely on outdated systems to run their business. Integrating legacy systems with modern technology can improve efficiency, streamline processes, and save time and money. However, it’s important to approach the integration process carefully and methodically to ensure success.